Would you like to get to know your target audience better? Would you like to know how many of your clients are from a specific region and what their responses to certain queries are? You can find it out quickly by using the statistics overview.
Screenshots
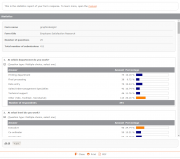
The statistics overview gives you a clear picture of the data entered into your forms. This data is presented both in absolute numbers and percentages. Data is also visualized with bar charts.
Filter
You can also call a subset of data by using a filter. This comes in handy when, for example, you would like to know how many of your female customers purchased a certain product.
Publish
You can also publish statistics to share them with others.


